Trading on Desktop
Hypercall's desktop interface is designed for active options trading. It combines a markets sidebar, price chart with Greeks, a full options chain, an order entry panel with payoff diagrams, and a portfolio management dashboard into a single view.
Open testnet.hypercall.xyz in any desktop browser to get started.
Before you begin, you need:
- A desktop browser (Chrome, Firefox, Safari, or Edge)
- A wallet or login method: Web3 wallet (MetaMask, Coinbase Wallet, WalletConnect) or email/social login via Privy
- Testnet funds from the faucet
Interface Layout
The desktop interface is split into several areas that work together. Here is the portfolio view you see after connecting your wallet:
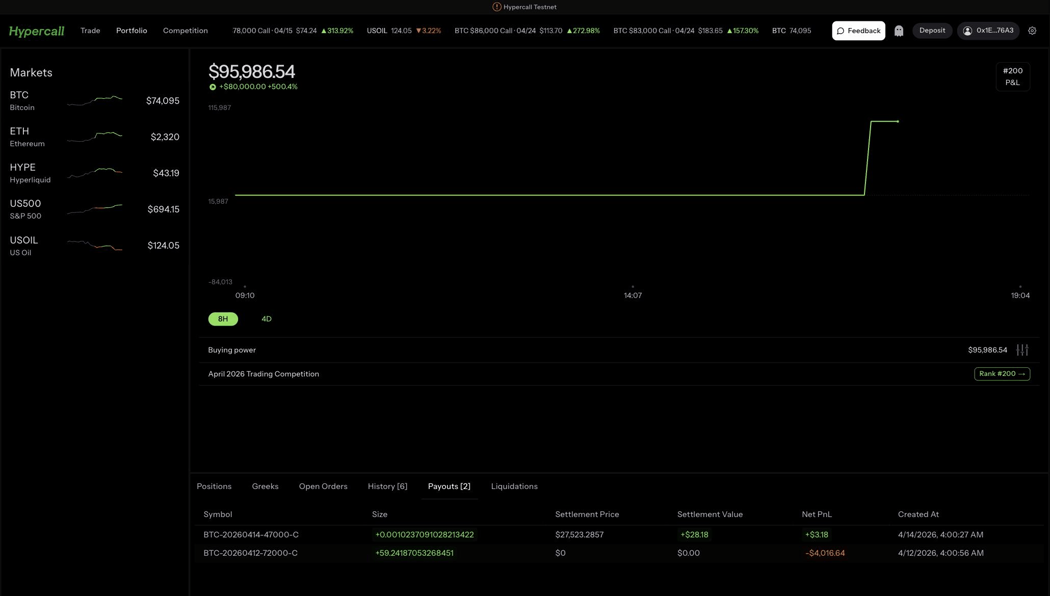
The portfolio view shows your equity, P&L chart, buying power, competition rank, and a tabbed data table at the bottom.
Top Navigation Bar
The top navigation bar contains:
| Element | Description |
|---|---|
| Hypercall logo | Click to return to the portfolio home |
| Trade | Opens the market selector to browse underlyings and options |
| Portfolio | Returns to the portfolio dashboard |
| Competition | Opens the monthly trading competition leaderboard |
| Ticker bar | Scrolling live prices and percentage changes for underlyings and trending contracts. Click any ticker to jump to that instrument. |
| Feedback | Opens the in-app feedback form to report bugs or suggestions |
| Deposit | Opens the deposit flow to fund your account or request testnet USDC |
| Wallet | Shows your connected wallet address. Click to view account details. |
| Settings (gear icon) | Opens the settings panel |
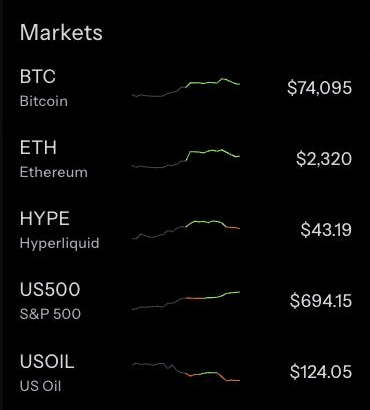
Markets Sidebar
The left sidebar shows all available underlyings with live prices and sparkline charts:
- BTC (Bitcoin)
- ETH (Ethereum)
- HYPE (Hyperliquid)
- US500 (S&P 500)
- USOIL (US Oil)
Click any underlying to navigate to its options chain.
Status Bar
The thin bar at the bottom of every screen shows:
- WebSocket status (green = connected, real-time data active)
- Wallet connection status
- Search shortcut hint
- Shortcuts shortcut hint
- Docs link
- Feedback link
Selecting a Market
Click Trade in the top nav to open the market selector. This overlay shows all available underlyings in a sortable table.
Click Trade to open the market selector. Browse underlyings with live prices, 24h change, volume, and open interest. Switch between Markets and Options tabs.
Markets Tab
The default view lists all underlyings. Each row shows:
| Column | Description |
|---|---|
| Markets | Underlying name and icon |
| Last Price | Current spot price |
| 24h Change | Price change and percentage over the last 24 hours |
| Volume | 24-hour trading volume in USD |
| Open Int. | Total open interest across all strikes and expiries |
Click any column header to sort. Click a row to navigate to that underlying's options chain.
Options Tab
Switch to the Options tab to search across all listed option contracts. You can filter by instrument name (e.g., "BTC 78000 Call"), underlying, or type. Results are sortable by bid, ask, IV, moneyness, expiry, and strike.
Keyboard Navigation
The market selector supports full keyboard navigation:
| Key | Action |
|---|---|
| ↑ ↓ | Navigate between rows |
| Enter | Select the highlighted row |
| Tab | Switch between Markets and Options tabs |
| Esc | Close the selector |
The Options Chain
After selecting an underlying, you see the full trading view with three panels.
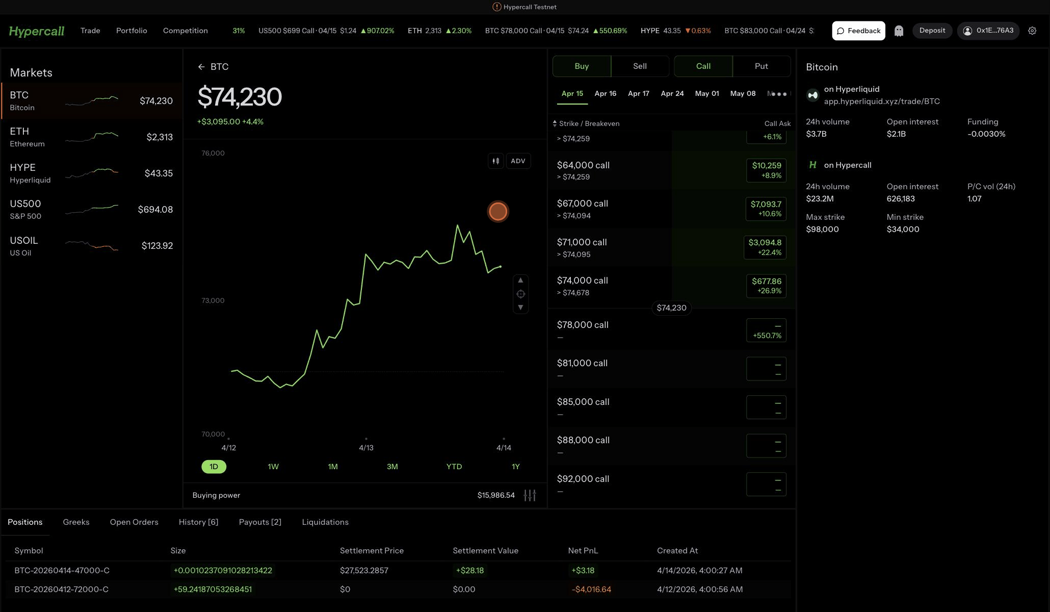
The BTC options chain showing the price chart with Greeks on the left, strike list in the center, and market data on the right.
Left Panel: Price Chart and Greeks
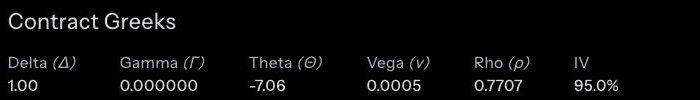
The Greeks row appears below the chart when you select a specific strike.
- Price chart for the underlying or selected contract, with time range buttons (1D, 1W, 1M, 3M, YTD, 1Y)
- ADV toggle for advanced chart mode
- Contract Greeks displayed below the chart when a specific strike is selected:
- Buying power shown at the bottom
Center Panel: Strike List
At the top of the chain:
- Buy / Sell toggle - Select your order direction
- Call / Put toggle - Select the option type
- Expiry tabs - Quick-select from available expiry dates (e.g., Apr 15, Apr 16, Apr 17, Apr 24, May 01, May 08, and more via the overflow menu)
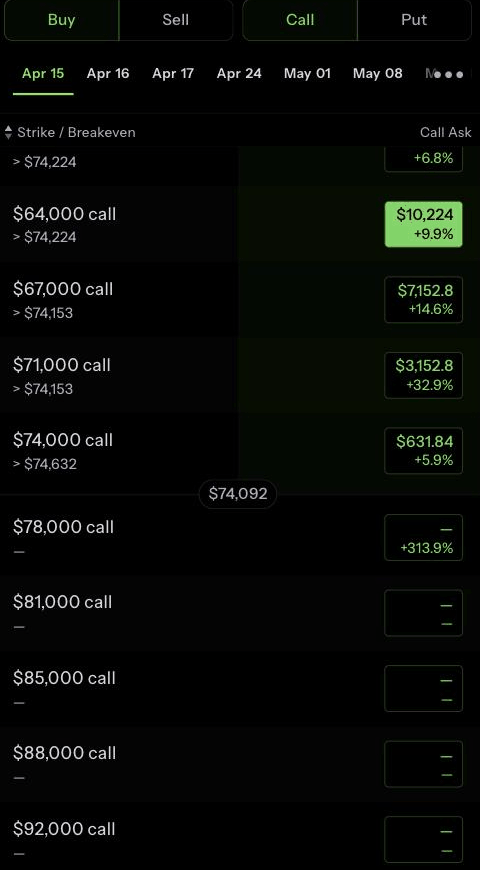
Each row in the strike list shows:
- Strike price and breakeven level
- Call Ask price with a colored bar indicating relative value
- 24h change percentage
Strikes near the current spot price are highlighted. Strikes with active liquidity show filled price bars; illiquid strikes show empty boxes.
Right Panel: Market Data
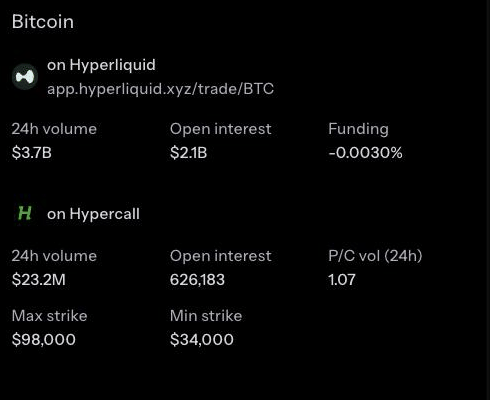
For the selected underlying:
- On Hyperliquid: 24h volume, open interest, and funding rate from the Hyperliquid perp market
- On Hypercall: 24h volume, open interest, put/call volume ratio, max strike, and min strike
Placing an Order
Click any strike in the chain to load the order entry panel on the right side of the screen.
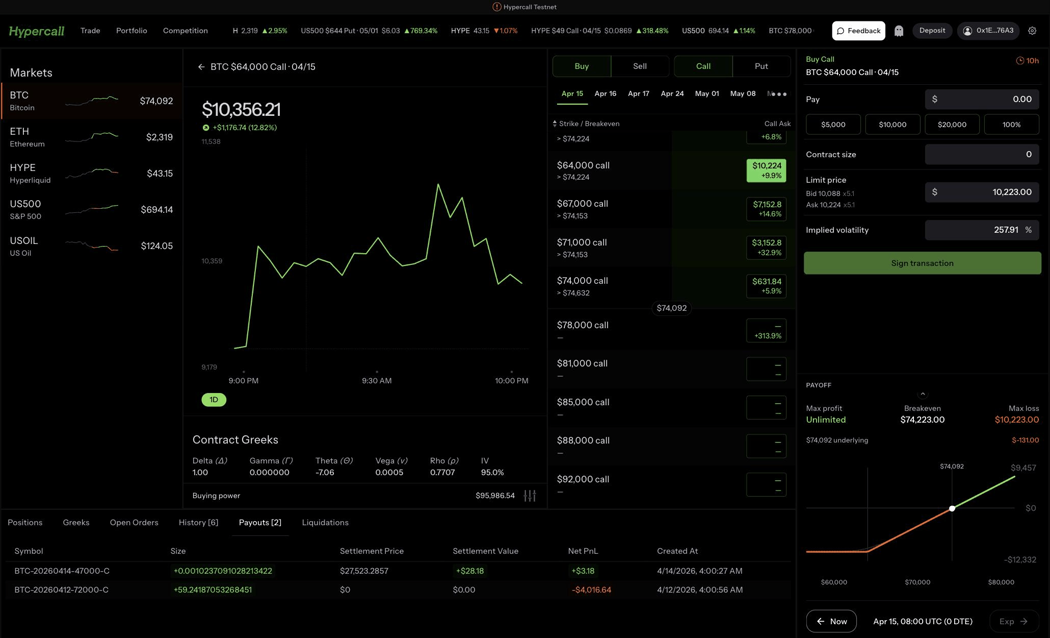
The complete trading view after selecting a strike: chart and Greeks on the left, options chain in the center, order form and payoff diagram on the right.
Click any strike to open the order panel. The limit price pre-fills from the current ask, and a payoff diagram shows max profit, breakeven, and max loss.
Order Panel
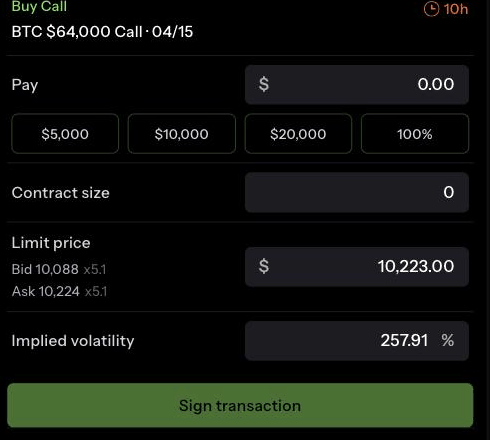
The order panel shows:
| Field | Description |
|---|---|
| Buy Call / Buy Put | Header showing the selected direction and contract |
| Pay | Dollar amount presets (1,500, $3,000, 100%) for quick sizing |
| Contract size | Number of contracts to trade. Fractional sizes are supported. |
| Limit price | Pre-filled with the current ask price. Shows the current bid and ask with size below. |
| Implied volatility | Slider to adjust your limit price based on IV. Moving the slider recalculates the limit price using Black-Scholes. |
| Sign transaction | Submit the order. This triggers a wallet signature request. |
| Timer (top right) | Countdown showing how long the pre-filled quote remains valid |
Payoff Diagram
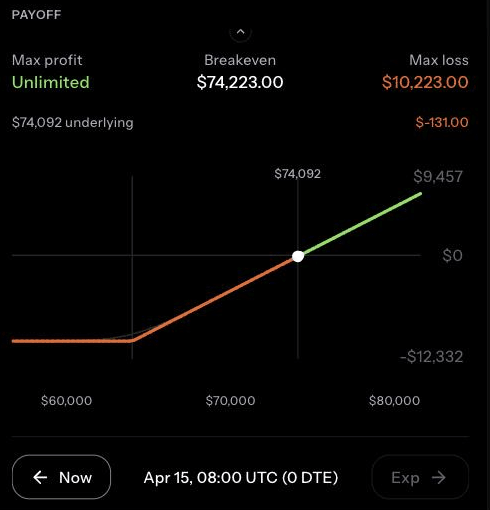
Below the order panel, a payoff diagram shows your potential outcomes:
- Max profit - The theoretical maximum gain (unlimited for long calls)
- Breakeven - The underlying price where the trade breaks even
- Max loss - The maximum you can lose (limited to premium paid for long options)
- Current underlying price marked on the x-axis
- Now vs Expiry toggle to see current value vs value at expiration
The green line shows profit and the red line shows loss at various underlying prices.
Order Flow
- Select Buy or Sell and Call or Put
- Choose an expiry date from the tabs
- Click a strike in the chain
- Adjust contract size or use a dollar amount preset
- Optionally adjust the limit price or use the IV slider
- Review the payoff diagram
- Click Sign transaction
- Approve the EIP-712 signature in your wallet
- The order appears in the Open Orders tab in your portfolio
Portfolio Management
Click Portfolio in the top nav to return to the portfolio dashboard.
Equity Overview
The top section shows:
- Total equity in USD
- P&L for the current period with percentage
- Competition rank (e.g., #204) with a link to the leaderboard
- Equity chart with 8H and 4D time range toggles
- Buying power showing available margin for new trades
- Account settings button (sliders icon next to buying power)
Portfolio Tabs
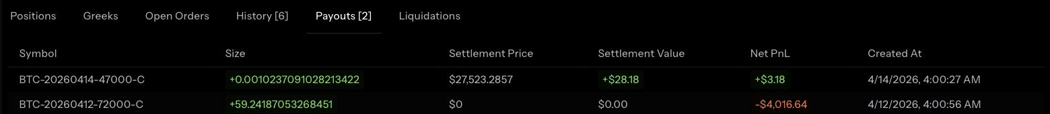
The Payouts tab showing settlement results for expired BTC call options.
The bottom section has six tabs:
Positions Tab
Shows all open positions with:
- Instrument - Contract name (e.g., BTC-20260414-47000-C)
- Amount - Position size (positive = long, negative = short)
- Entry Price - Average fill price
- Notional Val - Current notional value
- Margin Posted - Margin held for this position
- Realized PnL - Locked-in profit or loss from partial closes
- Unrealized PnL - Mark-to-market profit or loss
- Close button to initiate a closing trade
Greeks Tab
Displays your aggregate portfolio Greeks so you can see your net delta, gamma, theta, and vega exposure across all positions.
Open Orders Tab
Lists all pending limit orders with the ability to cancel individual orders.
History Tab
Shows all executed fills with timestamps, prices, and sizes.
Payouts Tab
Lists settlement outcomes for expired options, showing settlement price, settlement value, net PnL, and the timestamp.
Liquidations Tab
Records any liquidation events that have affected your account.
Search
Press Ctrl+K to open the command palette. This is the fastest way to find any market or contract.
The command palette has two tabs:
Markets Search
Type a ticker or name to filter underlyings. Results show:
- Last price
- 24h change (price and percentage)
- Volume and open interest
Click any result or press Enter to navigate to that market.
Options Search
Search across all listed option contracts. Type a partial name like "BTC 78" or "ETH Call" to filter. Results show:
- Contract name and friendly description (e.g., "$78,000 Call")
- Bid and ask prices
- Implied volatility
- Moneyness percentage
- Expiration date
Results lazy-load in batches of 100 for fast browsing across large option chains.
Keyboard Shortcuts
Press Ctrl+/ to open the keyboard shortcuts overlay.
The keyboard shortcuts overlay and market search are both accessible via keyboard from any screen.
| Shortcut | Action |
|---|---|
| Ctrl+K | Open search / command palette |
| Ctrl+, | Open settings |
| Ctrl+/ | Show keyboard shortcuts overlay |
| Esc | Close the current modal or go back |
| ↑ ↓ | Navigate lists and search results |
| Enter | Select or confirm the current item |
Shortcuts adapt to your platform automatically.
Ghost Mode
Ghost mode lets you view any wallet's portfolio in read-only mode. This is useful for:
- Analyzing another trader's positions and strategy
- Sharing a view of your own book with a counterparty
- Reviewing a sub-account without switching wallets
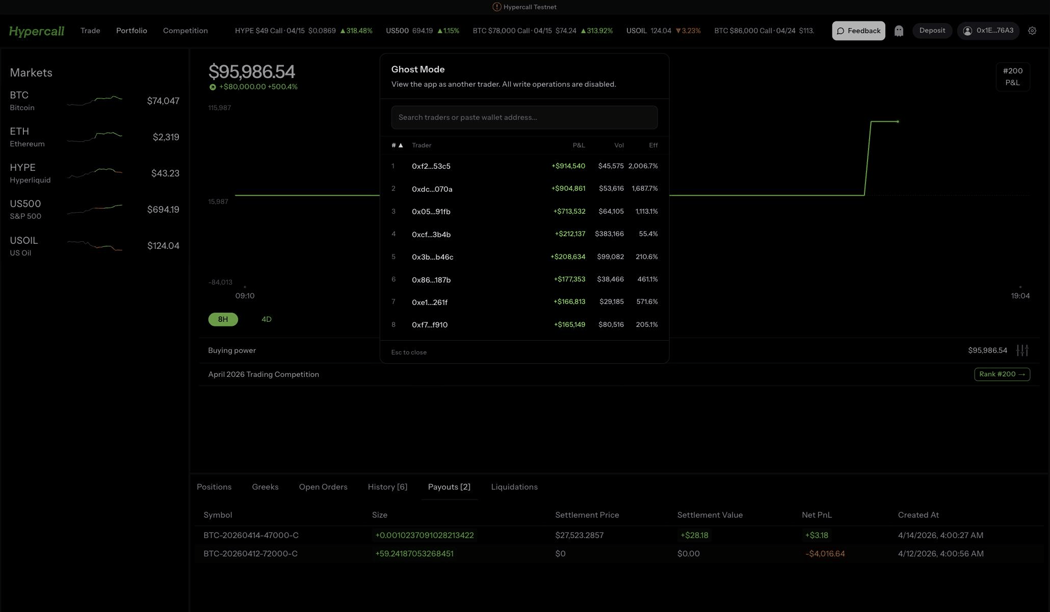
The ghost mode dialog shows top traders ranked by P&L, volume, and efficiency. Search by wallet address or click a trader to view their portfolio.
Activating Ghost Mode
- Click the ghost icon button in the top nav bar (between Feedback and Deposit)
- Enter the wallet address you want to view
- The app switches to a read-only view of that wallet's portfolio
When ghost mode is active:
- A purple banner appears at the top: "Orders cannot be placed in ghost mode"
- All portfolio data (positions, Greeks, history, payouts, liquidations) reflects the ghost wallet
- Order placement is disabled
- The URL updates to include
?ghost=<address>, so you can bookmark or share the link
Exiting Ghost Mode
Click the "Switch ghost" button to change to a different wallet, or click the ghost icon again to return to your own account.
Settings
Click the gear icon in the top-right corner of the nav bar or press Ctrl+, to open the settings panel.
Position Display
Controls how position values appear in the options chain when you have an open position at a strike:
| Setting | What it shows |
|---|---|
| Position Value (default) | Current market value of the position with P&L percentage |
| P&L | Unrealized profit or loss with percentage change from entry |
| Cost Basis | Original entry value of the position |
Options Chain Display
Controls what additional data appears next to each strike in the chain:
| Setting | What it shows |
|---|---|
| Breakeven Price (default) | The underlying price where exercising the option covers the premium paid |
| Greeks Plus | Select up to five metrics to display per strike: Delta, Gamma, Theta, Vega, and IV |
Settings are saved locally in your browser and persist across sessions.
Push Notifications
Hypercall supports browser push notifications so you get alerted on fills and liquidations even when the app is not open.
Enabling Notifications
- Click the bell icon or notification prompt in the app
- Your browser asks for notification permission. Click Allow.
- Hypercall registers your browser with the push service and signs the subscription with your wallet via EIP-712.
- You start receiving notifications immediately.
If you have already granted notification permission and reconnect your wallet, the app re-registers automatically.
Notification Types
| Type | When it fires | What it says |
|---|---|---|
| Fill | An order fills (maker or taker side) | Action (Bought/Sold), size, symbol, price, and realized PnL |
| Liquidation | Your account liquidation state changes | Previous state, new state (e.g., Healthy to Warning) |
| Settlement | An option expires and settles | (Coming soon) |
Managing Preferences
You can toggle each notification type on or off. Open the notification settings in the app to configure:
{
  "fills": true,
  "liquidations": true,
  "settlements": true
}
All types are enabled by default. Changes take effect immediately.
How It Works
Notifications use the Web Push API standard. A service worker runs in the background and displays notifications when the server pushes an event. Clicking a notification opens the app.
Supported browsers: Chrome (FCM), Firefox (Mozilla Push), Edge (WNS), and Safari (APNs). Each wallet can have up to 10 active subscriptions (e.g., multiple browsers or devices).
API Endpoints
For programmatic integration, see the Push Notifications section in the API Reference:
| Endpoint | Description |
|---|---|
POST /push/subscribe | Register a browser push subscription |
POST /push/unsubscribe | Remove a subscription |
POST /push/preferences | Update notification type preferences |
All endpoints require EIP-712 signature authentication with a PushAction message.
Ticker Bar
The scrolling ticker bar at the top of every page shows live data for underlyings and active option contracts. Each ticker entry shows:
- Symbol or contract name
- Price or last trade
- Percentage change (green for up, red for down)
Click any ticker to navigate directly to that instrument's trading view. The ticker bar updates in real time via WebSocket.
Tips for Desktop Trading
- Use keyboard shortcuts for speed. Ctrl+K to search, ↑ ↓ to navigate, Enter to select.
- Watch the Greeks panel below the chart when evaluating a trade. Delta tells you directional exposure, theta shows your daily time decay cost, and vega shows vol sensitivity.
- Check the payoff diagram before every trade. It shows your exact max loss, breakeven, and profit potential.
- Use the IV slider to set limit prices based on implied volatility rather than dollar prices. This is especially useful when the market is moving fast.
- Monitor the Payouts tab after expiry to see settlement results and verify your PnL.
- Use Ghost mode to study how other traders are positioned before deciding on your own strategy.
See Also
- Your First Trade (Mobile) - Mobile-specific trading walkthrough
- Testnet Faucet - How to get testnet funds
- Reporting Bugs - Submit feedback via the in-app tool
- Margining - How margin, liquidation, and settlement work
- API Trading - Programmatic access for automated trading
- Monthly Competition - Compete for prizes on the leaderboard